dbt docs: Find Any Table in 5 Seconds (Not 90 Minutes)
You're staring at dim_customer_v3_final_REAL in your warehouse.
No description. No owner. No documentation. Just 47 cryptic columns and a desperate need to ship by EOD.
You fire off Slack messages. Check three channels. DM that senior engineer. Search six months of history.
90 minutes later, you finally find the right table. It wasn't dim_customer_v3_final_REAL. It was customer_orders_mart.
Here's what this costs you: 90 minutes per search × 8 times per week × $75/hour = $900 weekly. For a 5-person team? That's $234,000 yearly spent hunting for information that should be documented.
dbt docs gives you searchable documentation with visual lineage. Find any table in 5 seconds.
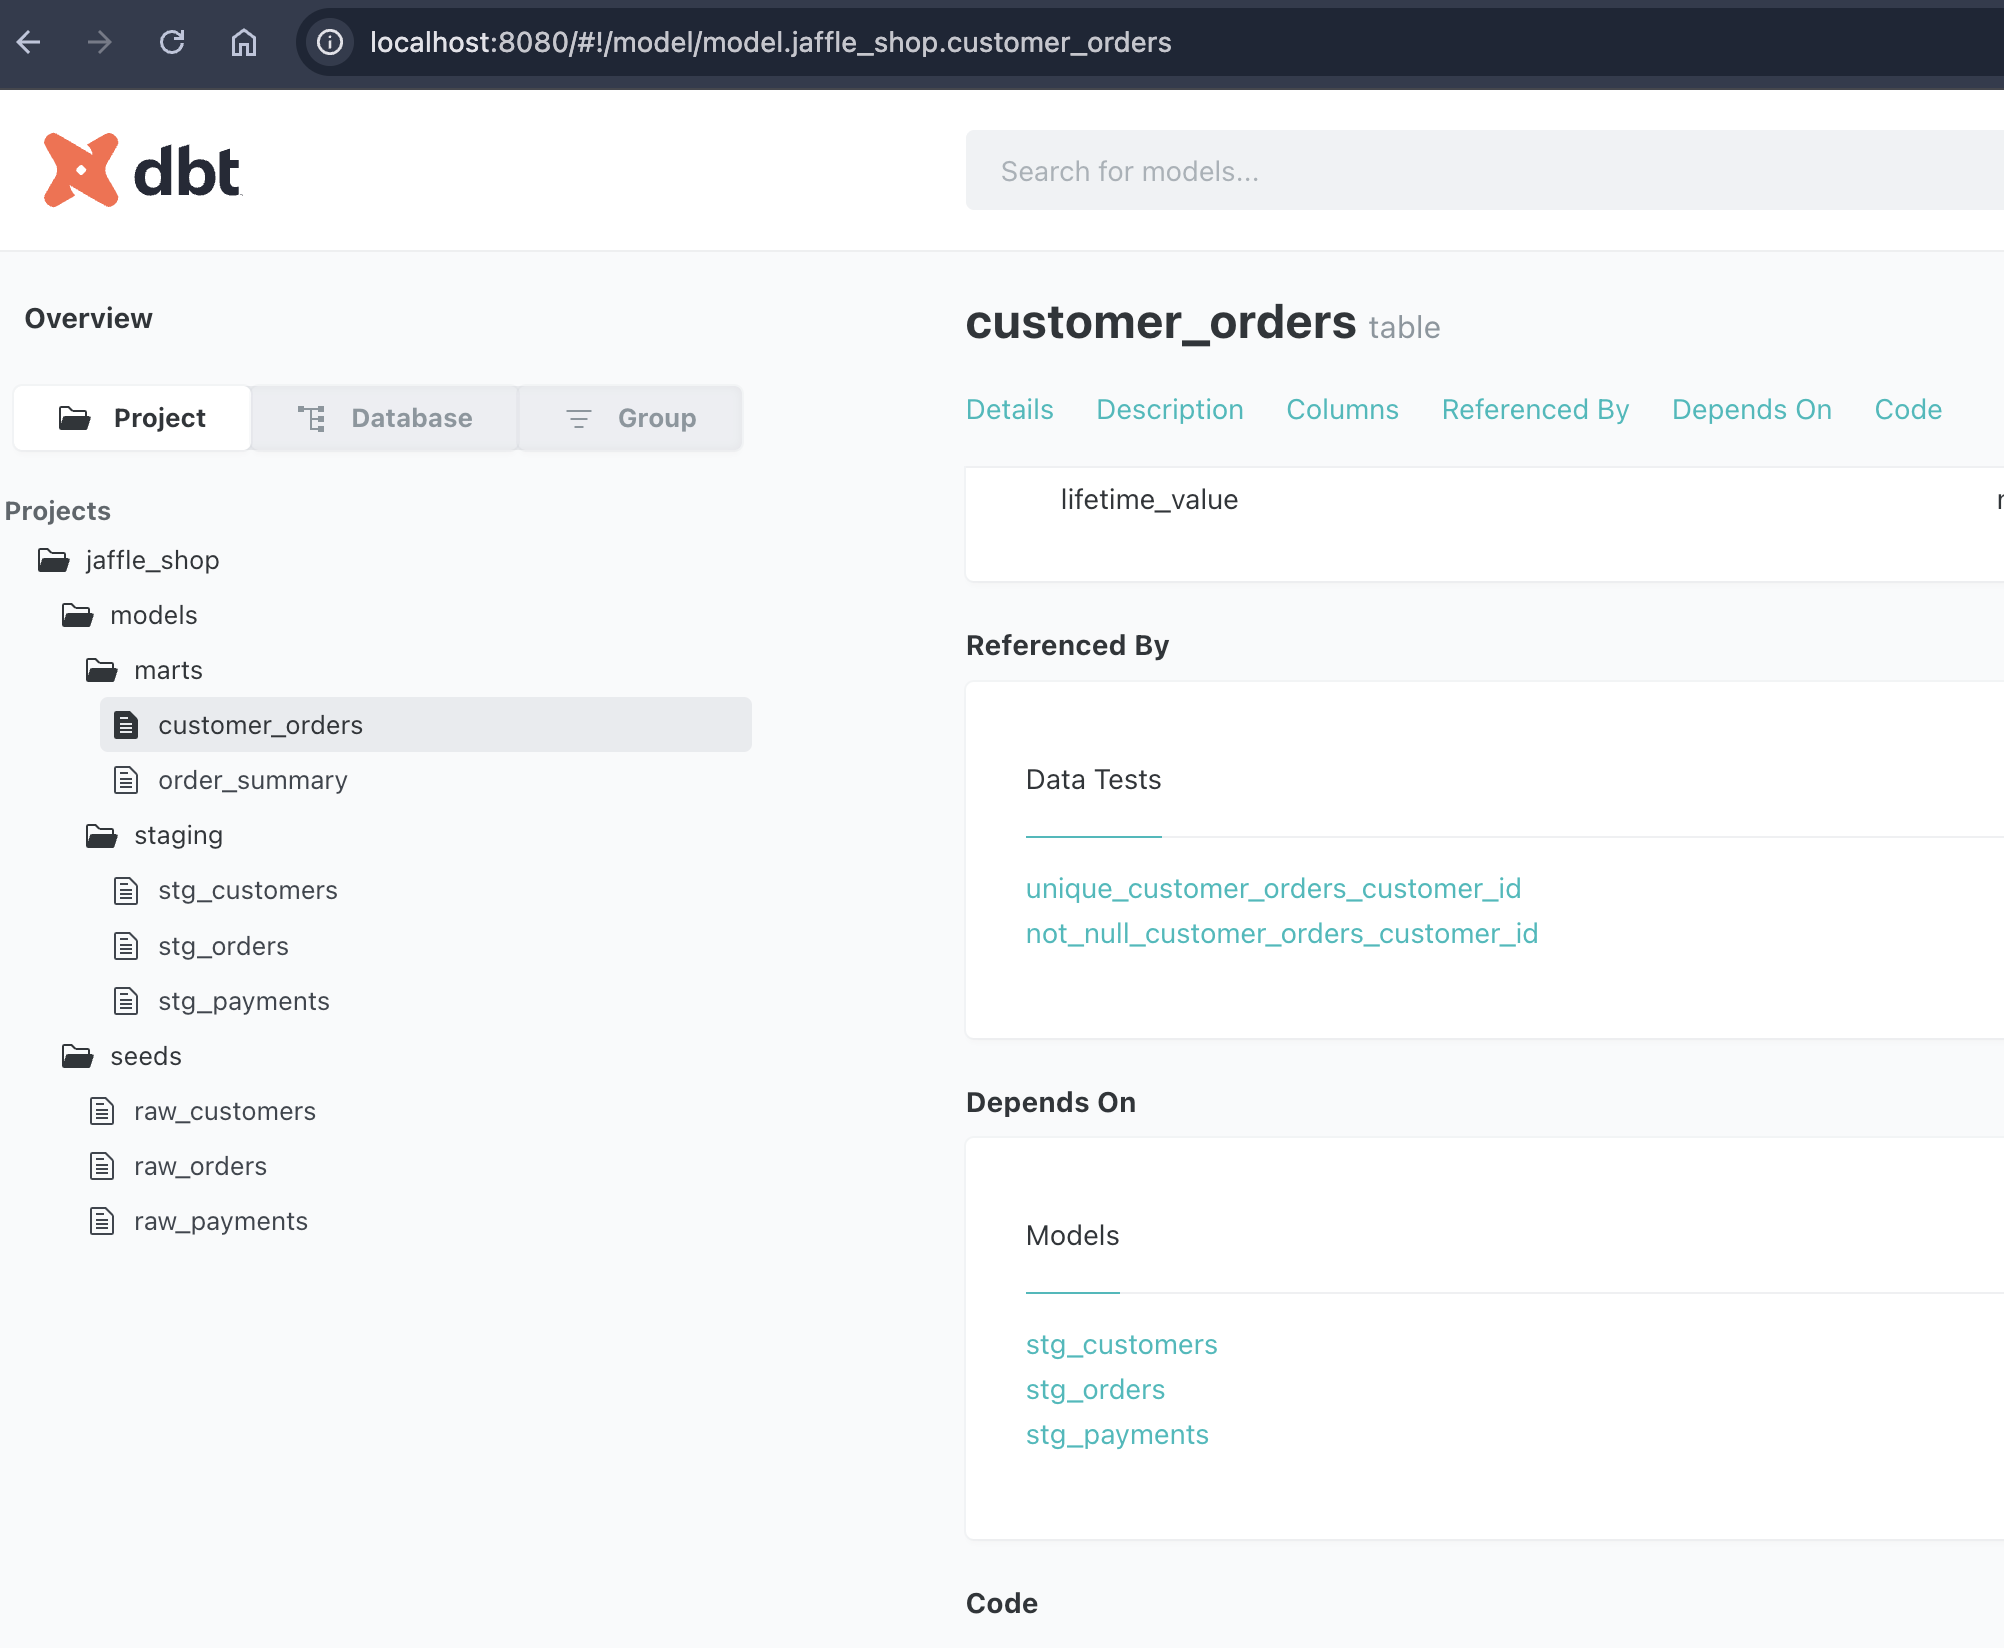 ^ This is what the dbt docs site looks like. You can browse your data lineage and easily find what you're looking for.
What dbt docs Changes
Without dbt docs:
- 90 minutes searching Slack, grep'ing SQL files
- Google Docs 8 months out of date
- New hires need 3 weeks to become productive
- Tribal knowledge walks out when engineers quit
With dbt docs:
- Search bar finds tables in 5 seconds
- Auto-generated from code, always in sync
- New hires productive in 2 days
- Documentation survives team turnover
dbt docs Visual Lineage Graph
Someone asks: "Can I drop raw_payments? Is anything using it?"
Without lineage:
- Manually search hundreds of SQL files
- Hope you don't miss dependencies
- Get paged at 2 AM when something breaks
With dbt lineage:
- Click
raw_paymentsin the graph - Instantly see
stg_payments→order_summary→customer_ordersall depend on it - Make informed decision in 10 seconds
Generate dbt docs in 20 Minutes
This is my working example on GitHub. Feel free to check it out. Here's some instructions:
Clone the working example:
git clone https://github.com/michael-oswald/dbt-practice
cd dbt-practice
docker-compose up -d
Build and generate docs:
dbt seed --profiles-dir .
dbt run --profiles-dir .
dbt docs generate --profiles-dir .
dbt docs serve --profiles-dir .
Open http://localhost:8080. You now have searchable documentation with full lineage graphs.
What dbt docs Gives You
Search any table instantly:
Type "lifetime value" in the search bar. Find customer_orders table in 5 seconds. See column descriptions, data types, and lineage.
Visual data flow: Click any model to see exactly where data comes from and where it flows. Color-coded layers show raw → staging → marts.
Auto-generated, always in sync: Documentation updates automatically from your code. No manual Google Docs. No stale Confluence pages.
What You Gain
- Find tables in 5 seconds, not 90 minutes
- Save $$$,$$$ yearly for a 5-person team
- Onboard new analysts in 2 days, not 3 weeks
- Never manually update documentation again
- See all downstream dependencies instantly
What it costs: 20 minutes to set up. Zero maintenance.
Stop wasting 12 hours per week. Use dbt docs to generate searchable documentation today.
Enjoyed this post? Get more like it.
Subscribe to get my latest posts about data engineering, AI, and modern data stack delivered to your inbox.