dbt Tutorial: Beginner's Guide for Data Engineers
Intro
If you're a software engineer moving into data engineering, dbt will feel like coming home. It brings the engineering practices you already know like version control, testing, modularity, and CI/CD to the world of SQL transformations.
This comprehensive dbt tutorial will take you from zero to building production-ready data pipelines.
Let's Start!
Table of Contents
- What is dbt?
- Where does dbt fit in the stack?
- Super Simple Example of a dbt Use Case
- Hands on dbt tutorial: NBA Analytics Example
- Architecture Overview
- Key Takeaways
- Troubleshooting
- Resources
What is dbt?
dbt (data build tool) handles the "T" in "ETL" by transforming data with SQL.
Analogy: 🌲→🪑 Raw data is the tree; dbt is the milling, sanding, and craftsmanship that turns it into polished furniture (gold layer data).
dbt does one thing really well: It transforms raw data in your warehouse into clean, tested, documented datasets that end users can trust.
Where does dbt fit in the stack?
As you can see in the diagram below, dbt acts on the data already loaded into your warehouse (via tools like Fivetran or Airbyte) and transforms it into analytics-ready tables for BI tools like Looker, Tableau, or Mode.
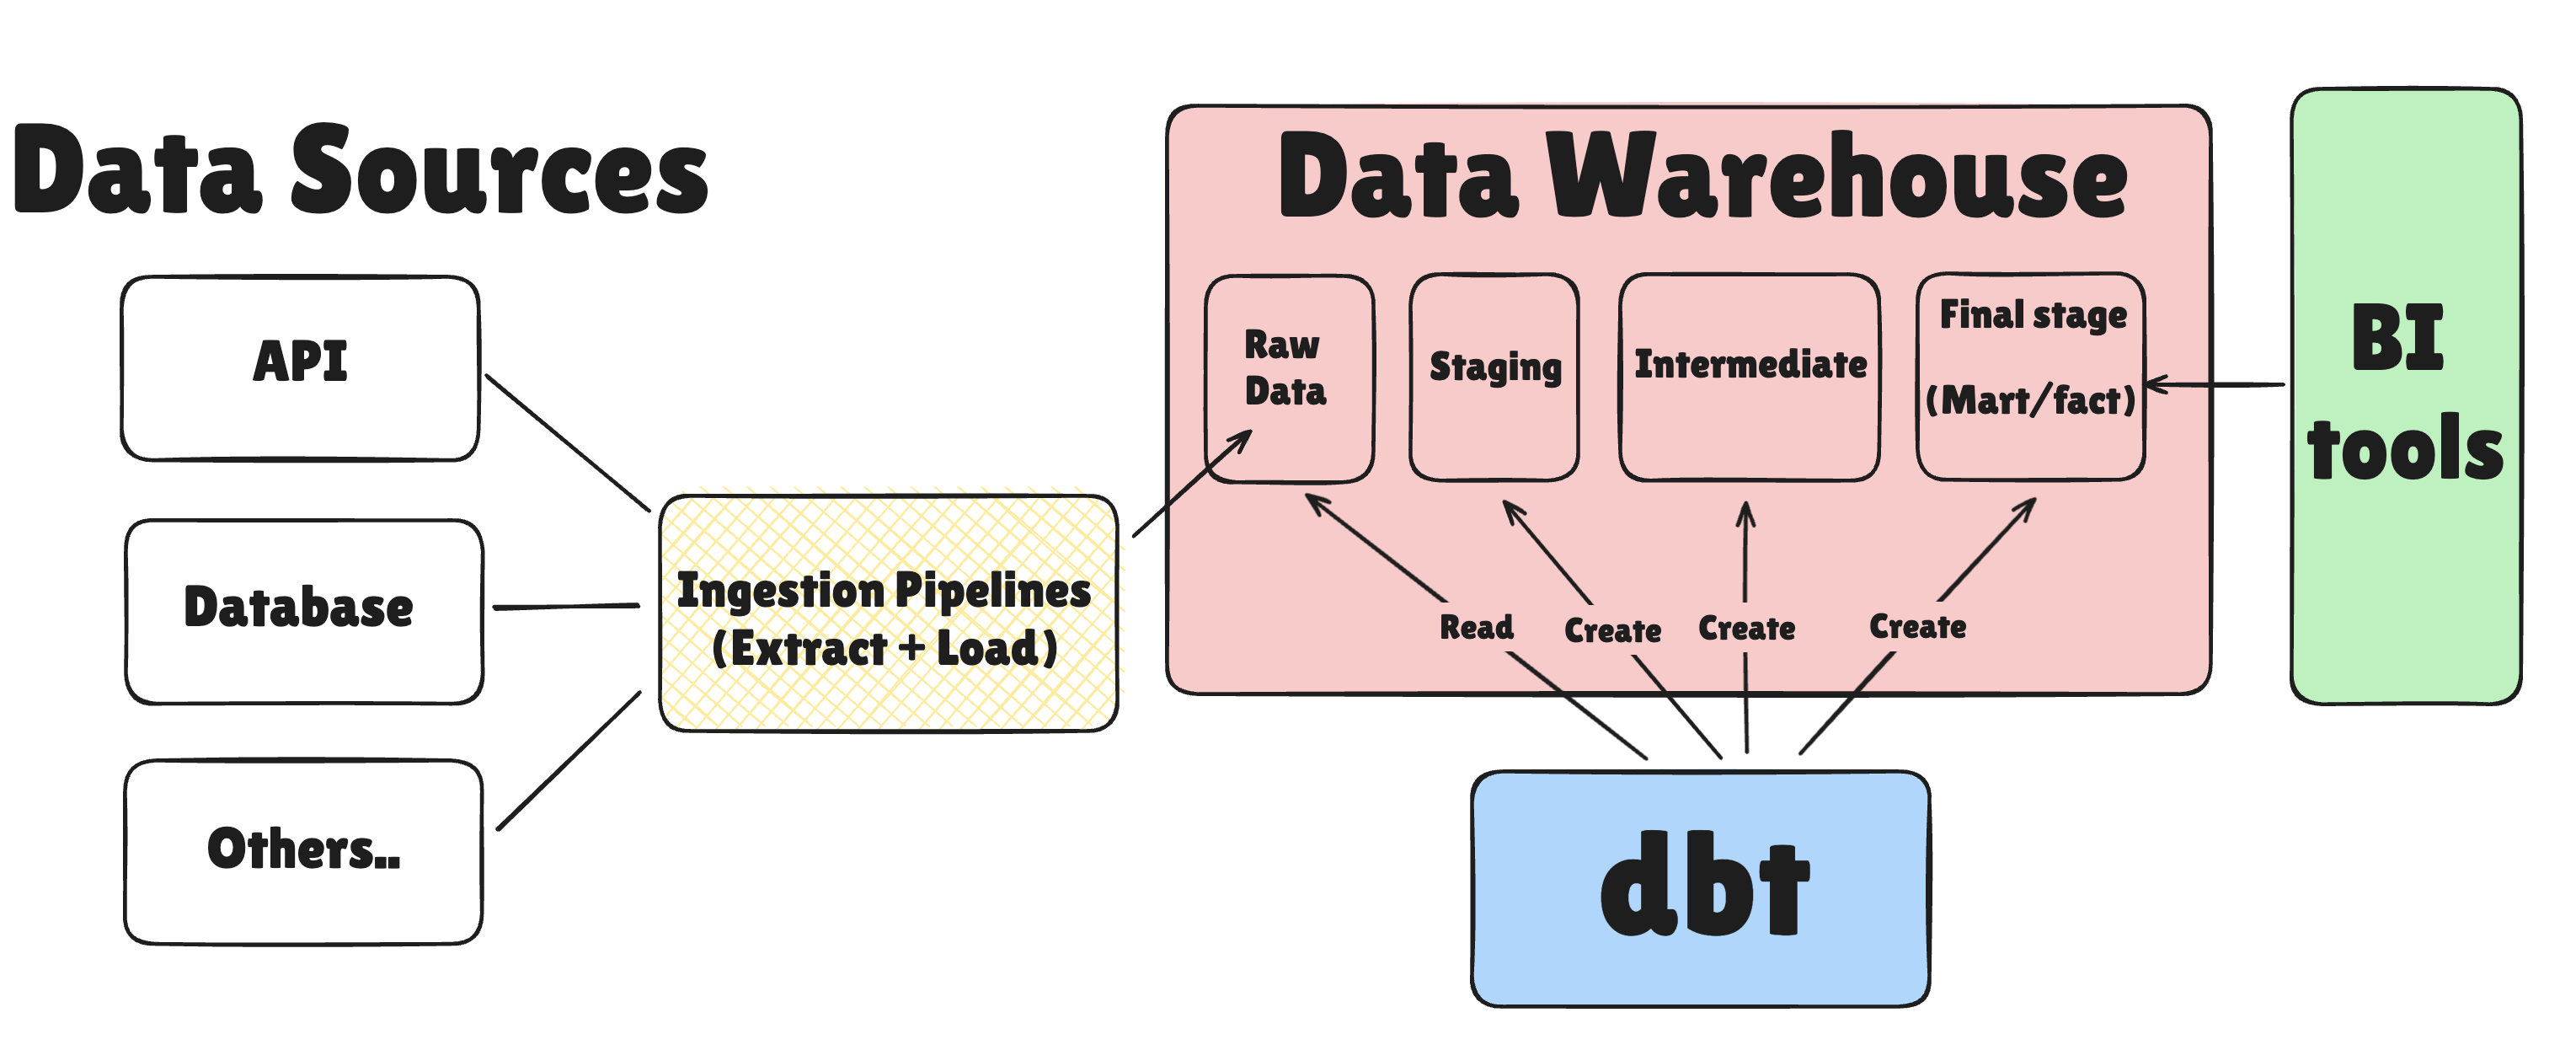
One thing I like about dbt is that it doesn't try to be everything to everyone. It focuses on doing SQL transformations really well, leaving data extraction and loading to other tools.
Super Simple Example of a dbt Use Case
Let's say you want to clean and standardize some customer raw customer data you have in your warehouse.
- You have raw data in your warehouse (e.g., a
raw.customerstable). - You create a dbt model (
models/staging/stg_customers.sql) to clean and standardize that data (remove duplicates, rename/remove columns) - Define tests to ensure data quality (no null emails, unique customer IDs)
- You document the model with descriptions for each column
- You run
dbt run, which creates a new table/view (stg_customers) in your warehouse with the cleaned data - You run
dbt testto validate the data quality - You generate documentation with
dbt docs generateand serve it - Your data analysts now query
stg_customersfor reliable customer data
⚠️ Now you could totally do this with raw python or SQL scripts, but dbt adds structure, testing, documentation, and version control that make it manageable as your data grows.
Next, let's build a real-world dbt project from scratch!
Hands on dbt tutorial: NBA Analytics Example
We'll create an NBA analytics project with dbt and Postgres.
Since I'm a Nuggets fan here in Colorado, we'll focus on answering this question:
"Which Nuggets players are the most consistent scorers?" 🤔
Building an NBA Player Stats Pipeline with dbt: A Complete Tutorial
💡 Want the complete code? Get the full working project on GitHub: dbt-nuggets-nba
What we'll build:
- A Postgres data warehouse (Docker)
- Python ingestion scripts using the NBA API
- A dbt project with staging → intermediate → marts layers
- Player-level fact table for consistency analysis
Time commitment: ~1 hour
Prerequisites
Install these before starting:
- Python 3.11+
- Docker Desktop
- Git
- SQL client Optional - (DBeaver, pgAdmin, or DataGrip)
Part 1: Environment Setup
We'll set up an isolated Python environment with all the tools needed for this tutorial.
1.1 Create Project Directory
Create a dedicated folder to keep all tutorial files organized.
mkdir -p nuggets_dbt_tutorial
cd nuggets_dbt_tutorial
1.2 Create Python Virtual Environment
Isolate Python packages in a virtual environment to avoid conflicts with your system Python.
# Create virtual environment
python3.11 -m venv dbt-env

# Activate it
source dbt-env/bin/activate  # macOS/Linux
# OR
dbt-env\Scripts\activate     # Windows
1.3 Install Python Dependencies
Install dbt, NBA API client, and database tools needed for the pipeline.
pip install \
  dbt-postgres \
  nba_api \
  pandas \
  sqlalchemy \
  psycopg2-binary
Expected output:
Successfully installed dbt-core-1.x.x dbt-postgres-1.x.x ...
Part 2: Spin Up Postgres Database
We'll launch a Postgres database in Docker to serve as our data warehouse for storing NBA stats.
2.1 Start Postgres in Docker
Run the following command to start your Postgres 16 container with user nuggets, password nuggets, and database nuggets_db.
docker run --name nuggets-postgres \
  -e POSTGRES_USER=nuggets \
  -e POSTGRES_PASSWORD=nuggets \
  -e POSTGRES_DB=nuggets_db \
  -p 5432:5432 \
  -d postgres:16
What this does:
- Creates a Postgres 16 container named
nuggets-postgres - Sets up user
nuggetswith passwordnuggets - Creates database
nuggets_db - Maps port 5432 (container) → 5432 (localhost)
- Runs in detached mode (
-d)
2.2 Verify Postgres is Running
Confirm the Postgres container is running and accessible on port 5432.
docker ps
Expected output:
CONTAINER ID   IMAGE         STATUS         PORTS                    NAMES
abc123...      postgres:16   Up 10 seconds  0.0.0.0:5432->5432/tcp   nuggets-postgres
2.3 Test Connection
Verify we can connect to the database using the credentials we set.
docker exec -it nuggets-postgres psql -U nuggets -d nuggets_db
You should see:
psql (16.x)
nuggets_db=#
Type \q to exit.
Part 3: Ingest NBA Data
We'll fetch real NBA game and player data from the NBA API and load it into our Postgres warehouse as raw tables.
We will use the nba_api Python library to fetch Denver Nuggets game logs and player box scores for the 2023-24 season.
We'll store the raw data in two Postgres tables:
public.raw_nba_gamespublic.raw_nba_boxscores
3.1 Create Scripts Directory
Organize ingestion scripts in a dedicated folder for better project structure.
mkdir -p nuggets_nba/scripts
cd nuggets_nba
3.2 Create scripts/ingest_games.py
Build a script to fetch all Nuggets games for the 2023-24 season from the NBA API.
Create this file with the following content:
from nba_api.stats.endpoints import TeamGameLog
import pandas as pd
from sqlalchemy import create_engine

# Configuration
NUGGETS_TEAM_ID = "1610612743"
SEASON = "2023-24"
DB_URL = "postgresql+psycopg2://nuggets:nuggets@localhost:5432/nuggets_db"

# Fetch Nuggets game logs
print(f"Fetching Nuggets games for {SEASON} season...")
game_log = TeamGameLog(team_id=NUGGETS_TEAM_ID, season=SEASON)
df = game_log.get_data_frames()[0]

# Clean column names
df_clean = df.rename(columns={
    'Game_ID': 'game_id',
    'GAME_DATE': 'game_date',
    'MATCHUP': 'matchup',
    'WL': 'win_loss',
    'PTS': 'team_points'
})

# Add season column
df_clean['season'] = SEASON

# Select relevant columns
df_clean = df_clean[[
    'game_id', 'season', 'game_date',
    'matchup', 'win_loss', 'team_points'
]]

# Write to Postgres
print(f"Writing {len(df_clean)} games to database...")
engine = create_engine(DB_URL)
df_clean.to_sql(
    'raw_nba_games',
    engine,
    schema='public',
    if_exists='replace',
    index=False
)

print("✅ Done! Games loaded into public.raw_nba_games")
print(f"Sample: {df_clean.head(3).to_dict('records')}")
3.3 Run Game Ingestion
Execute the script to populate the raw_nba_games table with 82 games.
python scripts/ingest_games.py
Expected output:
Fetching Nuggets games for 2023-24 season...
Writing 82 games to database...
✅ Done! Games loaded into public.raw_nba_games
Runtime: ~5-10 seconds
3.4 Create scripts/ingest_boxscores.py
Build a script to fetch detailed player statistics (box scores) for each game.
from nba_api.stats.endpoints import BoxScoreTraditionalV3
import pandas as pd
from sqlalchemy import create_engine
import time

# Configuration
DB_URL = "postgresql+psycopg2://nuggets:nuggets@localhost:5432/nuggets_db"

# Read games from database
print("Reading game IDs from database...")
engine = create_engine(DB_URL)
games_df = pd.read_sql("SELECT game_id FROM public.raw_nba_games", engine)
game_ids = games_df['game_id'].tolist()

print(f"Found {len(game_ids)} games to process...")

# Fetch box scores for each game
all_boxscores = []
for i, game_id in enumerate(game_ids, 1):
    print(f"[{i}/{len(game_ids)}] Fetching game {game_id}...")

    try:
        boxscore = BoxScoreTraditionalV3(game_id=game_id)
        df = boxscore.get_data_frames()[0]  # Player stats
        df['game_id'] = game_id
        all_boxscores.append(df)

        # Be nice to the API
        time.sleep(0.6)

    except Exception as e:
        print(f"   ⚠️  Error: {e}")
        continue

# Combine all box scores
print("\nCombining all box scores...")
df_all = pd.concat(all_boxscores, ignore_index=True)

# Rename columns to snake_case
column_mapping = {
    'gameId': 'gameid',
    'teamId': 'teamid',
    'teamCity': 'teamcity',
    'teamName': 'teamname',
    'teamTricode': 'teamtricode',
    'teamSlug': 'teamslug',
    'personId': 'personid',
    'firstName': 'firstname',
    'familyName': 'familyname',
    'nameI': 'namei',
    'playerSlug': 'playerslug',
    'position': 'position',
    'comment': 'comment',
    'jerseyNum': 'jerseynum',
    'minutes': 'minutes',
    'fieldGoalsMade': 'fieldgoalsmade',
    'fieldGoalsAttempted': 'fieldgoalsattempted',
    'fieldGoalsPercentage': 'fieldgoalspercentage',
    'threePointersMade': 'threepointersmade',
    'threePointersAttempted': 'threepointersattempted',
    'threePointersPercentage': 'threepointerspercentage',
    'freeThrowsMade': 'freethrowsmade',
    'freeThrowsAttempted': 'freethrowsattempted',
    'freeThrowsPercentage': 'freethrowspercentage',
    'reboundsOffensive': 'reboundsoffensive',
    'reboundsDefensive': 'reboundsdefensive',
    'reboundsTotal': 'reboundstotal',
    'assists': 'assists',
    'steals': 'steals',
    'blocks': 'blocks',
    'turnovers': 'turnovers',
    'foulsPersonal': 'foulspersonal',
    'points': 'points',
    'plusMinusPoints': 'plusminuspoints'
}

df_all = df_all.rename(columns=column_mapping)

# Write to database
print(f"Writing {len(df_all)} player-game records to database...")
df_all.to_sql(
    'raw_nba_boxscores',
    engine,
    schema='public',
    if_exists='replace',
    index=False
)

print("✅ Done! Box scores loaded into public.raw_nba_boxscores")
print(f"Total records: {len(df_all)}")
3.5 Run Box Score Ingestion
Run the script to load player-level stats into the raw_nba_boxscores table (this takes ~1 minute).
python scripts/ingest_boxscores.py
Expected output:
Reading game IDs from database...
Found 82 games to process...
[1/82] Fetching game 0022300001...
[2/82] Fetching game 0022300015...
...
✅ Done! Box scores loaded into public.raw_nba_boxscores
Total records: ~2,050
Runtime: ~1-2 minutes (0.6s per game × 82 games)
Pause here! Now you should have raw data in Postgres:
public.raw_nba_games(82 rows)public.raw_nba_boxscores(~2,050 rows)
Let's double check by connecting with a SQL client or using psql.
SELECT count(*) FROM public.raw_nba_games;
SELECT count(*) FROM public.raw_nba_boxscores;
Expected results:
 count

-------
    82
(1 row)

 count
-------
  2050
(1 row)
Part 4: Initialize dbt Project
We'll create a dbt project and configure it to connect to our Postgres database.
4.1 Create dbt Project
Generate a new dbt project with the standard folder structure for models, tests, and docs.
dbt init nuggets_nba
Prompts:
- Database:
postgres - Host:
localhost - Port:
5432 - User:
nuggets - Password:
nuggets - Database:
nuggets_db - Schema:
analytics - Threads:
4
OR skip prompts and configure manually (next step).
4.2 Configure ~/.dbt/profiles.yml
Tell dbt how to connect to our Postgres database by setting up connection credentials.
Create or edit ~/.dbt/profiles.yml:
nuggets_nba:
  target: dev
  outputs:
    dev:
      type: postgres
      host: localhost
      port: 5432
      user: nuggets
      password: nuggets
      dbname: nuggets_db
      schema: analytics
      threads: 4
4.3 Test dbt Connection
Verify dbt can successfully communicate with Postgres before building models.
cd nuggets_nba
dbt debug
Expected output:
Running with dbt=1.10.x
Configuration:
  profiles.yml file [OK found and valid]
  dbt_project.yml file [OK found and valid]
Connection:
  host: localhost
  port: 5432
  user: nuggets
  database: nuggets_db
  schema: analytics
  Connection test: [OK connection ok]

All checks passed!
Part 5: Build dbt Models
We'll transform the raw NBA data through multiple layers (staging → intermediate → marts) to calculate player scoring consistency.
5.1 Define Sources
Define source tables so dbt knows where to find our raw data and can track freshness.
Create models/staging/nba/_sources.yml:
version: 2

sources:
  - name: nba_raw
    description: "Raw NBA data ingested from nba_api"
    schema: public
    tables:
      - name: raw_nba_games
        description: "Nuggets team game logs from NBA API"
        columns:
          - name: game_id
            description: "Unique game identifier"

      - name: raw_nba_boxscores
        description: "Player box scores for each Nuggets game"
        columns:
          - name: gameid
            description: "Game identifier (links to raw_nba_games)"
          - name: personid
            description: "Unique player identifier"
Test sources:
dbt run-operation source --help # Just to verify syntax
5.2 Create Staging Model: stg_nba_games
Clean and standardize game data (rename columns, convert dates, add metadata).
Create models/staging/nba/stg_nba_games.sql:
{{ config(
    materialized = 'view',
    tags = ['staging', 'nba']
) }}

select
    game_id::text                    as game_id,
    season::text                     as season,
    to_date(game_date, 'MM/DD/YYYY') as game_date,
    matchup::text                    as matchup,
    win_loss::text                   as win_loss,
    team_points::int                 as team_points
from {{ source('nba_raw', 'raw_nba_games') }}
Build it:
dbt run --select stg_nba_games
Expected output:
1 of 1 START sql view model analytics.stg_nba_games ........ [RUN]
1 of 1 OK created sql view model analytics.stg_nba_games ... [CREATE VIEW in 0.05s]
5.3 Create Staging Model: stg_nba_boxscores
Clean and standardize player box score data with proper data types and column names.
Create models/staging/nba/stg_nba_boxscores.sql:
{{ config(
    materialized = 'view',
    tags = ['staging', 'nba']
) }}

select
    gameid::text        as game_id,
    gameid::text        as nba_game_id,
    teamid::bigint      as team_id,
    teamcity::text      as team_city,
    teamname::text      as team_name,
    teamtricode::text   as team_tricode,
    teamslug::text      as team_slug,

    personid::bigint    as player_id,
    firstname::text     as first_name,
    familyname::text    as family_name,
    namei::text         as name_i,
    playerslug::text    as player_slug,
    position::text      as position,
    comment::text       as comment,
    jerseynum::text     as jersey_num,

    minutes::text       as minutes_raw,

    fieldgoalsmade::int               as fgm,
    fieldgoalsattempted::int          as fga,
    fieldgoalspercentage::float       as fg_pct,
    threepointersmade::int            as tpm,
    threepointersattempted::int       as tpa,
    threepointerspercentage::float    as tp_pct,
    freethrowsmade::int               as ftm,
    freethrowsattempted::int          as fta,
    freethrowspercentage::float       as ft_pct,

    reboundsoffensive::int  as oreb,
    reboundsdefensive::int  as dreb,
    reboundstotal::int      as treb,
    assists::int            as ast,
    steals::int             as stl,
    blocks::int             as blk,
    turnovers::int          as tov,
    foulspersonal::int      as pf,
    points::int             as pts,
    plusminuspoints::int    as plus_minus

from {{ source('nba_raw', 'raw_nba_boxscores') }}
Build it:
dbt run --select stg_nba_boxscores
5.4 Create Intermediate Model: int_nuggets_player_game
Filter to only Nuggets players and join games with box scores to create player-game records.
Create models/intermediate/nba/int_nuggets_player_game.sql:
{{ config(
    materialized = 'view',
    tags = ['intermediate', 'nba', 'nuggets']
) }}

with box as (
    select *
    from {{ ref('stg_nba_boxscores') }}
),

-- Keep only Nuggets players
nuggets_only as (
    select
        game_id,
        nba_game_id,
        team_id,
        team_city,
        team_name,
        team_tricode,
        team_slug,
        player_id,
        first_name,
        family_name,
        name_i,
        player_slug,
        position,
        comment,
        jersey_num,
        minutes_raw,

        -- convert 'MM:SS' to numeric minutes (e.g. 32.5)
        case
            when minutes_raw is null or minutes_raw = '' or minutes_raw = '00:00' then 0
            else
                split_part(minutes_raw, ':', 1)::int
                + split_part(minutes_raw, ':', 2)::int / 60.0
        end as minutes,

        fgm,
        fga,
        fg_pct,
        tpm,
        tpa,
        tp_pct,
        ftm,
        fta,
        ft_pct,
        oreb,
        dreb,
        treb,
        ast,
        stl,
        blk,
        tov,
        pf,
        pts,
        plus_minus
    from box
    where team_tricode = 'DEN'  -- only Denver Nuggets
)

select * from nuggets_only
Build it:
dbt run --select int_nuggets_player_game
5.5 Create Mart Model: fct_player_game
Build the final analytics table with scoring consistency metrics (average, standard deviation, coefficient of variation).
Create models/marts/nba_nuggets/fct_player_game.sql:
{{ config(
    materialized = 'table',
    unique_key = 'player_game_key',
    tags = ['mart', 'fact', 'nba', 'nuggets']
) }}

with base as (
    select
        game_id,
        player_id,
        concat(game_id, '_', player_id) as player_game_key,

        -- player identity
        first_name,
        family_name,

        -- stats
        minutes,
        pts,
        ast,
        treb as rebounds,
        fgm,
        fga,
        tpm,
        tpa,
        ftm,
        fta,
        plus_minus
    from {{ ref('int_nuggets_player_game') }}
),

with_efficiency as (
    select
        *,
        case when fga > 0
            then (fgm::float / fga)
            else null
        end as fg_pct,

        case when tpa > 0
            then (tpm::float / tpa)
            else null
        end as three_pct,

        case when fta > 0
            then (ftm::float / fta)
            else null
        end as ft_pct
    from base
)

select * from with_efficiency
Build the entire lineage:
dbt run --select +fct_player_game
Expected output:
1 of 3 START sql view model analytics.stg_nba_boxscores ........... [RUN]
1 of 3 OK created sql view model analytics.stg_nba_boxscores ...... [CREATE VIEW in 0.06s]
2 of 3 START sql view model analytics.int_nuggets_player_game ..... [RUN]
2 of 3 OK created sql view model analytics.int_nuggets_player_game  [CREATE VIEW in 0.02s]
3 of 3 START sql table model analytics.fct_player_game ............ [RUN]
3 of 3 OK created sql table model analytics.fct_player_game ....... [SELECT 1847 in 0.15s]
🎉 You now have a player-game fact table!
5.6 Add Tests
Add data quality tests to catch issues like null values, duplicates, or invalid data.
Create models/marts/nba_nuggets/schema.yml:
version: 2

models:
  - name: fct_player_game
    description: "Player-level fact table with one row per player per game"
    columns:
      - name: player_game_key
        description: "Unique key: game_id + player_id"
        tests:
          - not_null
          - unique

      - name: game_id
        tests:
          - not_null

      - name: player_id
        tests:
          - not_null

      - name: pts
        description: "Points scored"
        tests:
          - not_null
Run tests:
dbt test --select fct_player_game
Expected output:
1 of 4 START test not_null_fct_player_game_player_game_key .... [RUN]
1 of 4 PASS not_null_fct_player_game_player_game_key .......... [PASS in 0.05s]
2 of 4 START test unique_fct_player_game_player_game_key ...... [RUN]
2 of 4 PASS unique_fct_player_game_player_game_key ............ [PASS in 0.06s]
...
Part 6: Query Your Data!
Now that our dbt pipeline has transformed the data, let's query it to answer our original question about scoring consistency.
6.1 Connect SQL Client to Postgres
Connect a SQL client to Postgres so you can explore the transformed tables visually.
Connection details:
- Host:
localhost - Port:
5432 - Database:
nuggets_db - User:
nuggets - Password:
nuggets - Schema:
analytics
6.2 Basic Query: Player Averages
Query the fact table to see each Nuggets player's average points per game.
select
    first_name || ' ' || family_name as player_name,
    count(*) as games_played,
    round(avg(pts)::numeric, 1) as avg_points,
    round(avg(ast)::numeric, 1) as avg_assists,
    round(avg(rebounds)::numeric, 1) as avg_rebounds,
    round(avg(minutes)::numeric, 1) as avg_minutes
from analytics.fct_player_game
group by 1
having count(*) >= 10
order by avg_points desc;
Sample results:
player_name         | games | avg_pts | avg_ast | avg_reb | avg_min
--------------------|-------|---------|---------|---------|--------
Nikola Jokić        | 79    | 26.4    | 9.0     | 12.4    | 34.6
Jamal Murray        | 59    | 21.2    | 6.5     | 4.1     | 31.5
Michael Porter Jr.  | 82    | 16.5    | 1.5     | 6.9     | 31.3
Aaron Gordon        | 73    | 13.9    | 3.5     | 6.5     | 31.5
6.3 Consistency Analysis: Coefficient of Variation
Calculate and rank players by scoring consistency using coefficient of variation (lower = more consistent).
Question: Who is the most consistent scorer?
Why Coefficient of Variation (CV)?
When comparing consistency between players with different scoring averages, standard deviation alone can be misleading. A player averaging 25 points with a standard deviation of 8 points is more consistent than a player averaging 10 points with the same 8-point standard deviation.
Coefficient of Variation (CV) solves this by expressing standard deviation as a percentage of the mean:
CV = (Standard Deviation / Mean) × 100
Why it works for this use case:
- Normalized comparison: Compare variability across players with different scoring levels
- Scale-independent: A 20% CV means the same level of consistency whether you score 10 or 30 points per game
- Lower is better: Lower CV = more predictable/consistent performance
🔥 Next run this query to find the most consistent Nuggets scorers:
select
    first_name || ' ' || family_name as player_name,
    count(*) as games_played,
    round(avg(pts)::numeric, 1) as avg_points,
    round(stddev(pts)::numeric, 2) as stddev_points,
    round(((stddev(pts) / nullif(avg(pts), 0)) * 100)::numeric, 1) as cv_points
from analytics.fct_player_game
group by 1
having
    count(*) >= 20
    and avg(minutes) >= 15
    and avg(pts) >= 5
order by cv_points asc;
Results:
player_name         | games | avg_pts | stddev | cv_points
--------------------|-------|---------|--------|----------
Nikola Jokić        | 79    | 26.4    | 8.16   | 30.9%    ← Most consistent!
Jamal Murray        | 59    | 21.2    | 7.83   | 36.9%
Aaron Gordon        | 73    | 13.9    | 5.27   | 38.0%
Michael Porter Jr.  | 82    | 16.5    | 6.97   | 42.2%
Interpretation:
- Lower CV = more consistent
- Jokić has a 30.9% coefficient of variation - remarkably consistent for 26.4 PPG
- Murray and Gordon are also very steady
- MPJ is more "feast or famine" at 42.2% CV
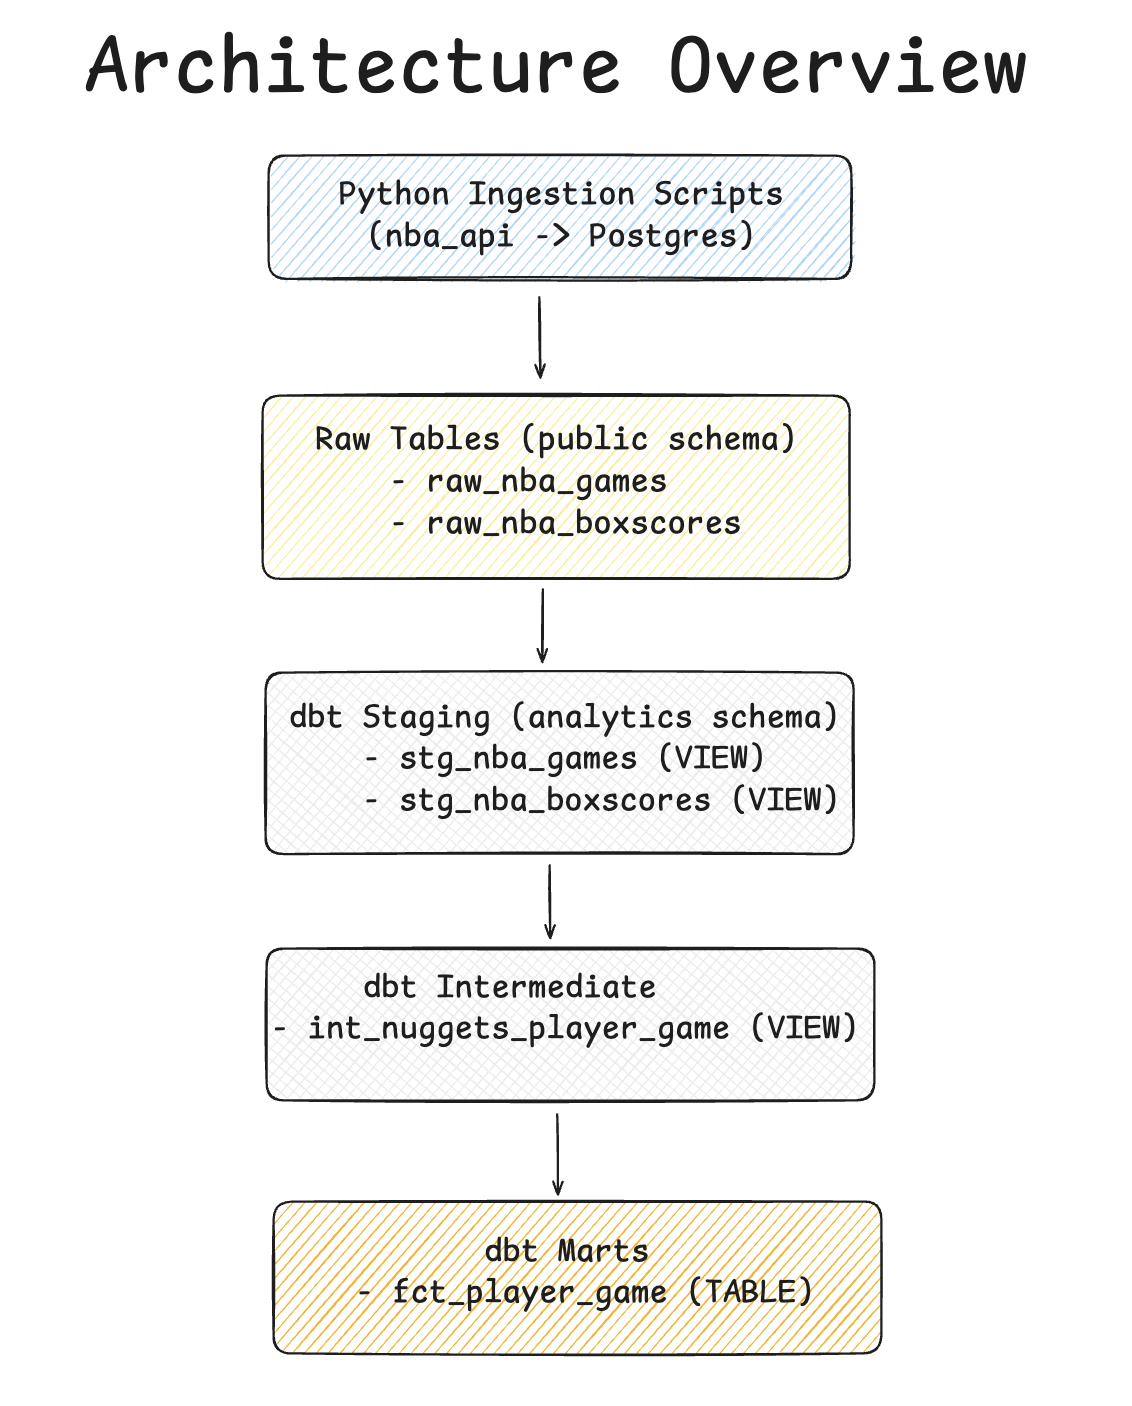
Architecture Overview
Below is a high-level architecture diagram of the dbt pipeline we built in this tutorial.
Key Takeaways
Hope you enjoyed this dbt tutorial! Here are the main takeaways:
Key benefits of dbt
- Modularity: Each model has a single responsibility
- Lineage: Dependencies flow cleanly (staging → intermediate → marts)
- Testing: Built-in data quality checks
- Documentation: Self-documenting with schema.yml files
- Incremental development: Build and test one layer at a time
What we learned about the Nuggets' 2023-24 season
🏀 Nikola Jokić is absurdly consistent - lowest variance among starters
Top 4 players (Jokić, Murray, Gordon, MPJ) all have <43% CV
🏀 Bench players have higher variance (50-72% CV) - expected for role players
What You Learned
- Real-world data pipeline architecture
- Python → Database ingestion
- dbt's medallion architecture (bronze/silver/gold or raw/staging/marts)
- Statistical analysis of sports data
- How to answer business questions with data
Troubleshooting
Common Issues
Problem: dbt debug fails with "could not connect to server"
- Solution: Ensure Docker container is running:
docker ps
Problem: Ingestion script fails with rate limit error
- Solution: Increase sleep time in
ingest_boxscores.pyto 1-2 seconds
Problem: fct_player_game has duplicate player_game_keys
- Solution: Check for duplicate games in
raw_nba_games- deduplicate at ingestion
Problem: Player minutes show as 0 or null
- Solution: Verify
minutes_rawformat in raw table - should be "MM:SS"
Resources
- dbt Docs: https://docs.getdbt.com
- nba_api GitHub: https://github.com/swar/nba_api
Acknowledgments
- Data provided by NBA.com via the unofficial
nba_apilibrary - This tutorial is for educational purposes only, demonstrating dbt and analytics engineering concepts
- Not affiliated with or endorsed by the NBA
You did it! 🎉
You've built a production-quality analytics pipeline from scratch. This same pattern (ingest → stage → transform → mart) scales to enterprise data warehouses.
Ready to level up your data engineering skills? Subscribe below for in-depth tutorials on dbt, data architecture, and modern data stack tools.
Enjoyed this post? Get more like it.
Subscribe to get my latest posts about data engineering, AI, and modern data stack delivered to your inbox.